Lidar Data
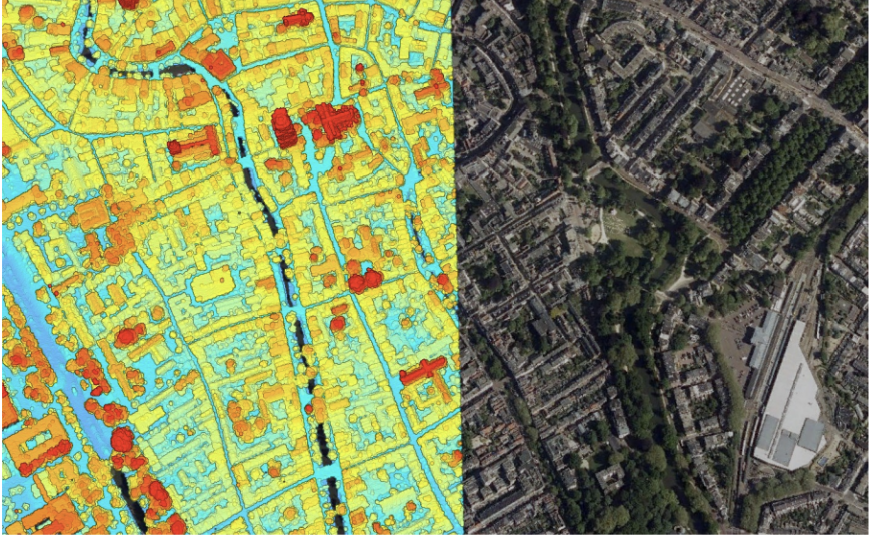
LiDAR (Light Detection and Ranging) data in GIS uses laser pulses to measure distances to the Earth's surface, creating 3D models of terrain and structures. 3D mapping can give us a more detailed and realistic visualisation of spatial data - aiding in better comprehension and planning. Figure 1. Elevation This symbology (colour scheme) represents the differences in height. The warm/red spectrum represents the highest
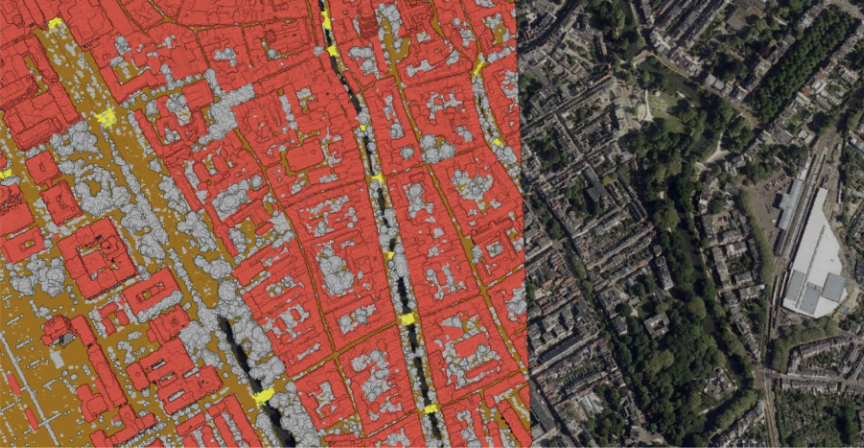
elevations which, in this case, are the building of Utrecht. Figure 2. Classification This symbology classifies the different land covers in Utrecht. One can see all the buildings are in red
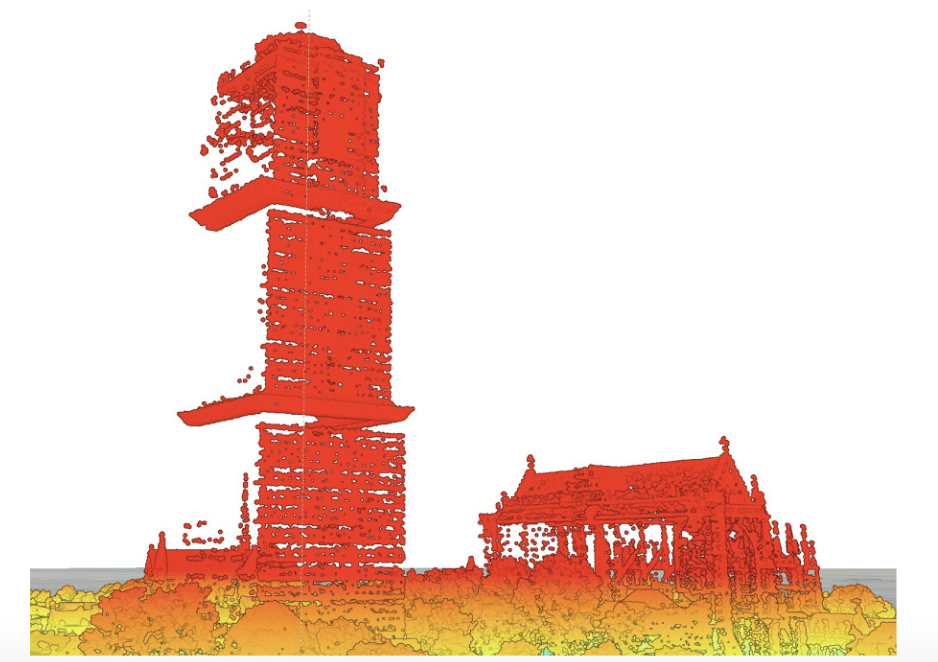
for example. The bridges across the canal have also been highlighted in yellow. Figure 3. Dom Tower In this 3D map the Dom Tower, the tallest church tower in the Netherlands at 112.32 metres in height, can be represented.